Watchtower
The Watchtower feature in APEX Project Eye provides comprehensive monitoring capabilities for your Oracle APEX applications and database environment. This powerful monitoring framework allows you to proactively track critical metrics, detect issues before they impact users, and ensure optimal system performance through automated sensors and notifications.
Key Benefits
Section titled “Key Benefits”- Proactive Monitoring: Detect issues before they impact end users
- Automated Alerts: Receive timely notifications when metrics exceed thresholds
- Custom Monitoring: Create tailored monitoring solutions for your specific needs
- Centralized Oversight: Monitor multiple applications and components in one place
- Historical Analysis: Track metrics over time to identify trends and patterns
- SLA Compliance: Ensure your applications meet service level agreements
Sensor Framework
Section titled “Sensor Framework”Create and manage custom monitoring sensors for various components:
- SQL-Based Sensors: Monitor any aspect of your environment with SQL queries
- Flexibility: Track metrics from applications, database, external services, or business processes
- Customizable Logic: Define exactly what to monitor and how to interpret the results
- Scheduling: Configure when and how often each sensor runs
- Group Organization: Categorize sensors for better management
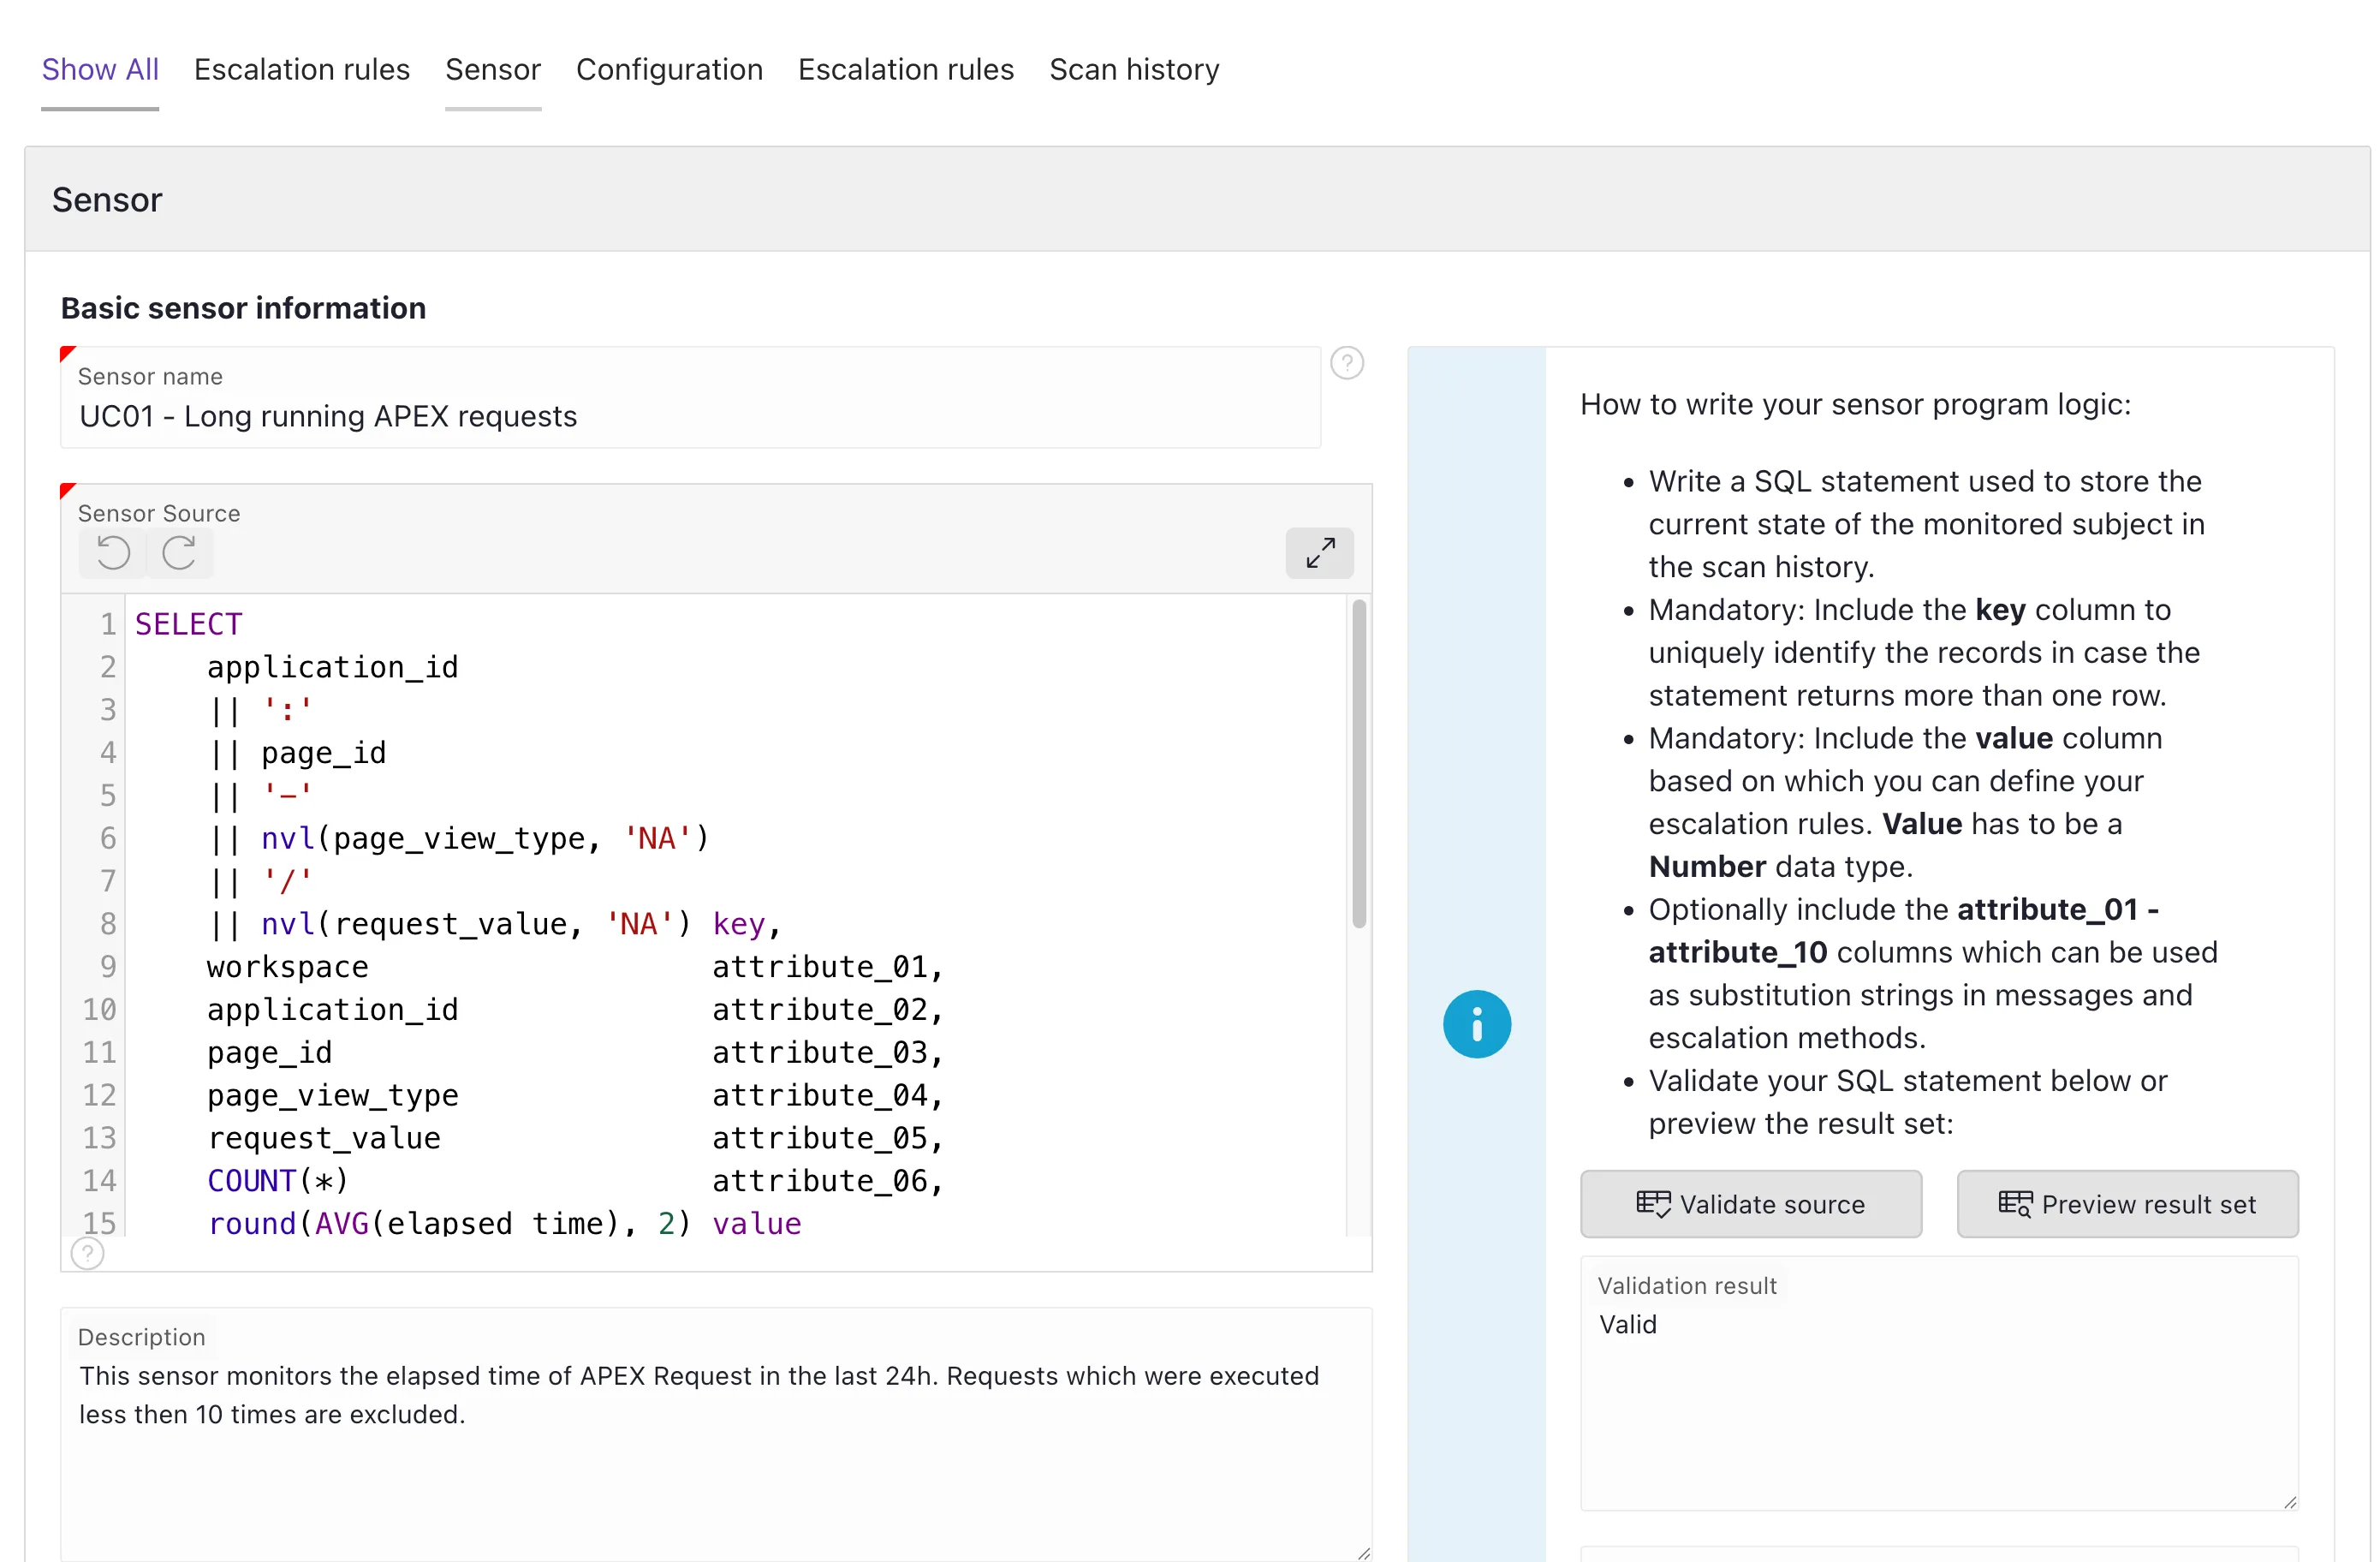
Configure custom sensors to monitor exactly what matters for your applications
Escalation
Section titled “Escalation”Define how the system should respond to different monitoring conditions:
- Threshold Definition: Set specific thresholds for normal, warning, and critical conditions
- Custom Messages: Define meaningful messages for each escalation level
- Notification Channels: Choose how to notify users (e.g., email, APE Inbox, custom)
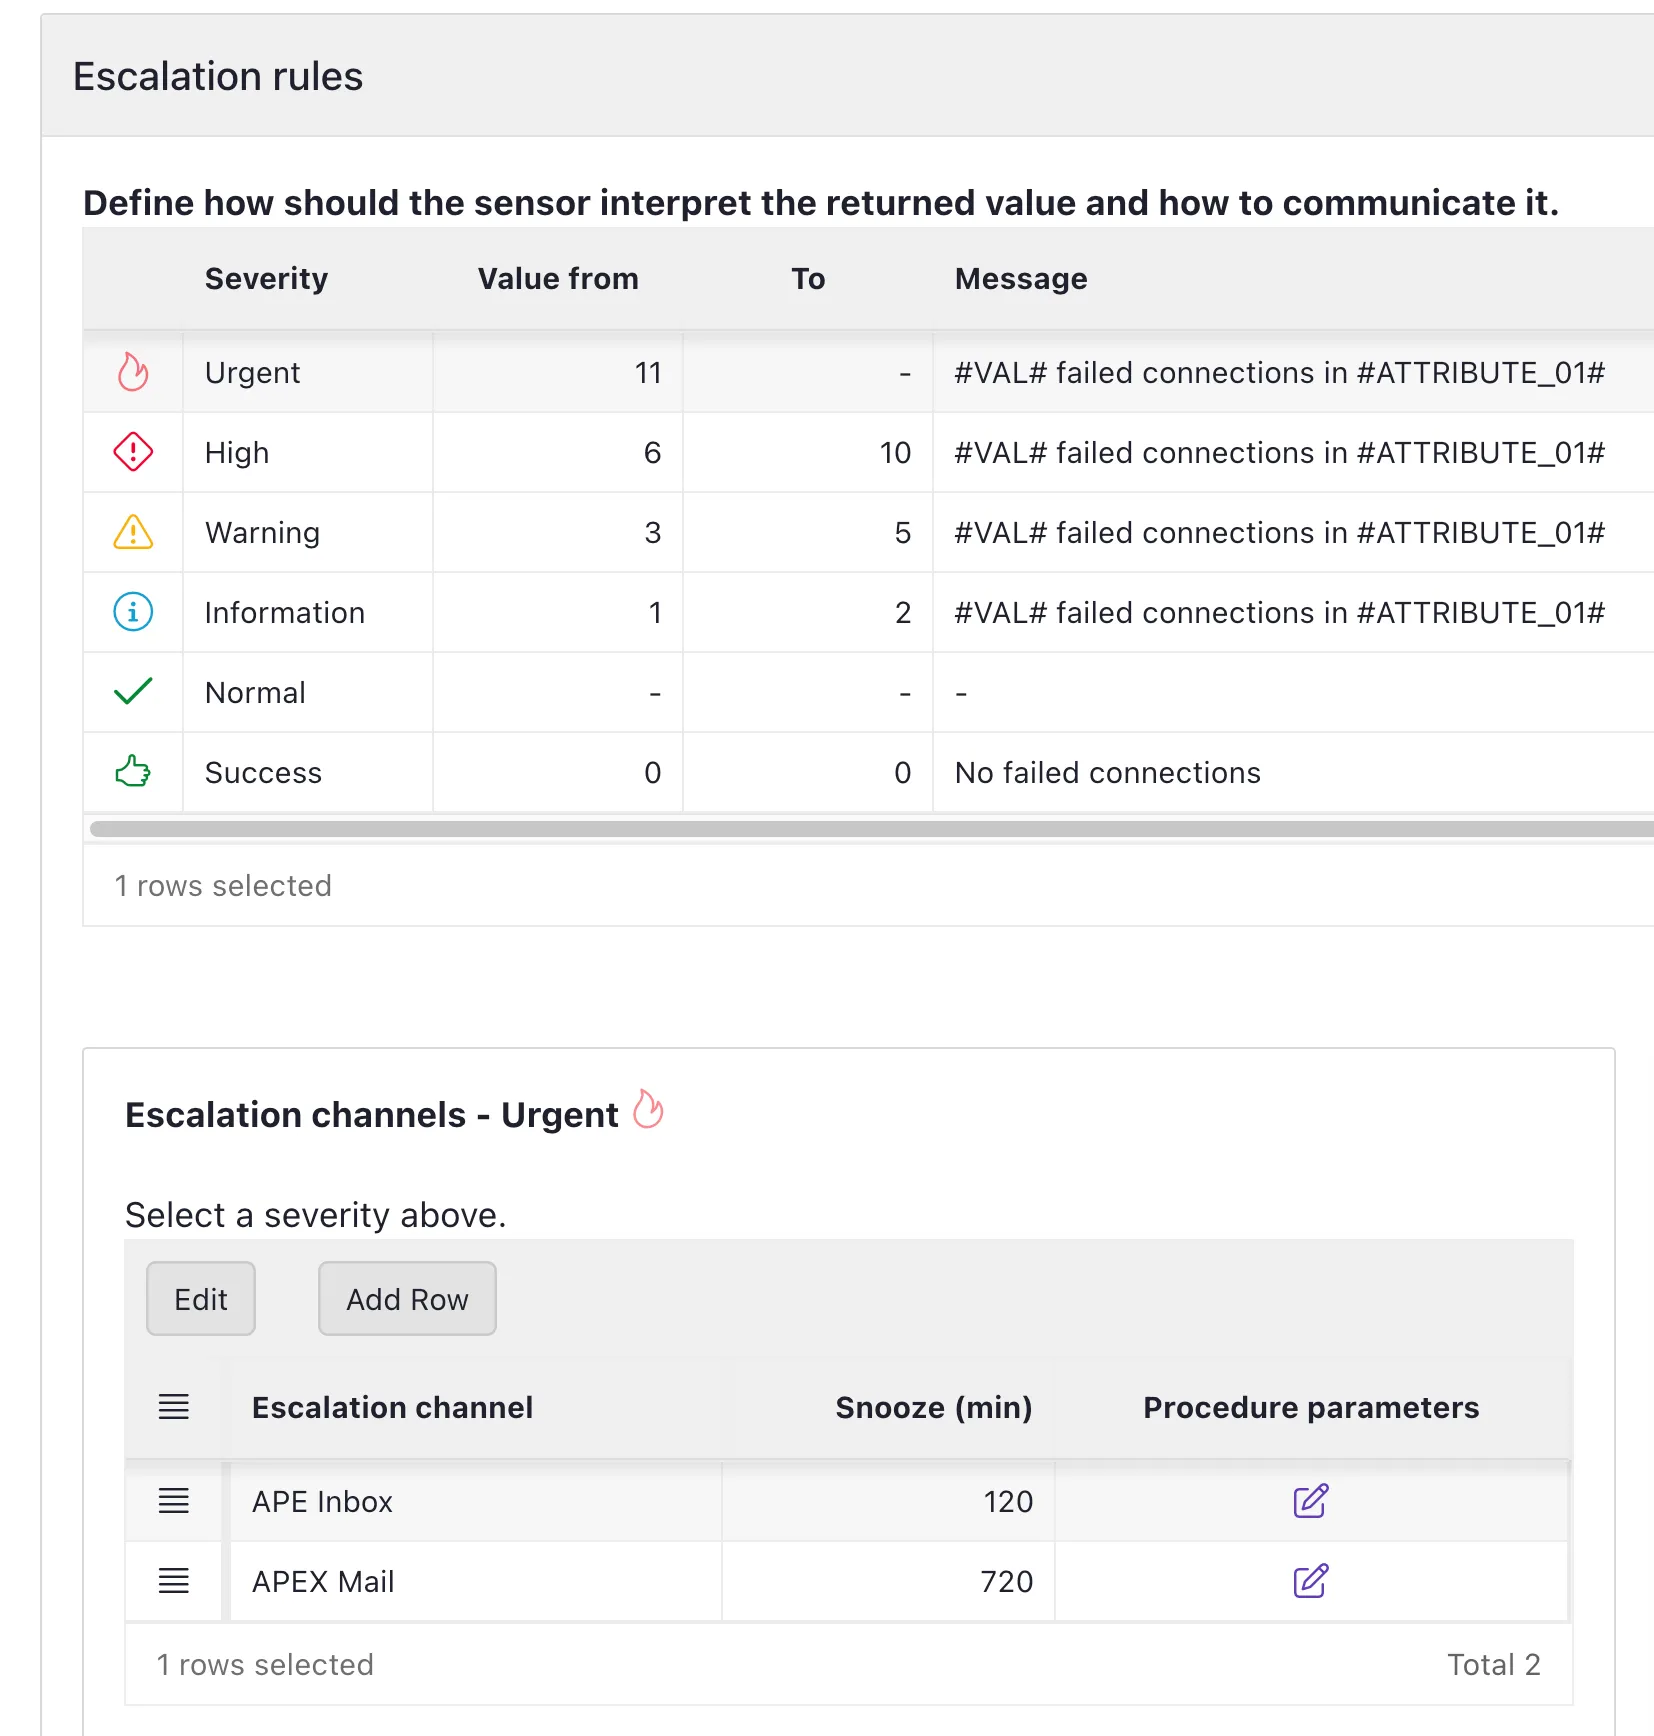
Define how your sensors interpret values and determine when to trigger alerts
Monitoring Dashboard
Section titled “Monitoring Dashboard”Customizable dashboard for viewing monitoring status:
- Real-time Status: See the current state of all monitored components
- Visual Indicators: Quickly identify issues with color-coded status indicators
- Filtering Options: Focus on specific application areas or sensor groups
- Drill-down Capability: Access detailed information about specific sensors
- Dashboard Customization: Tailor the dashboard to focus on your priorities
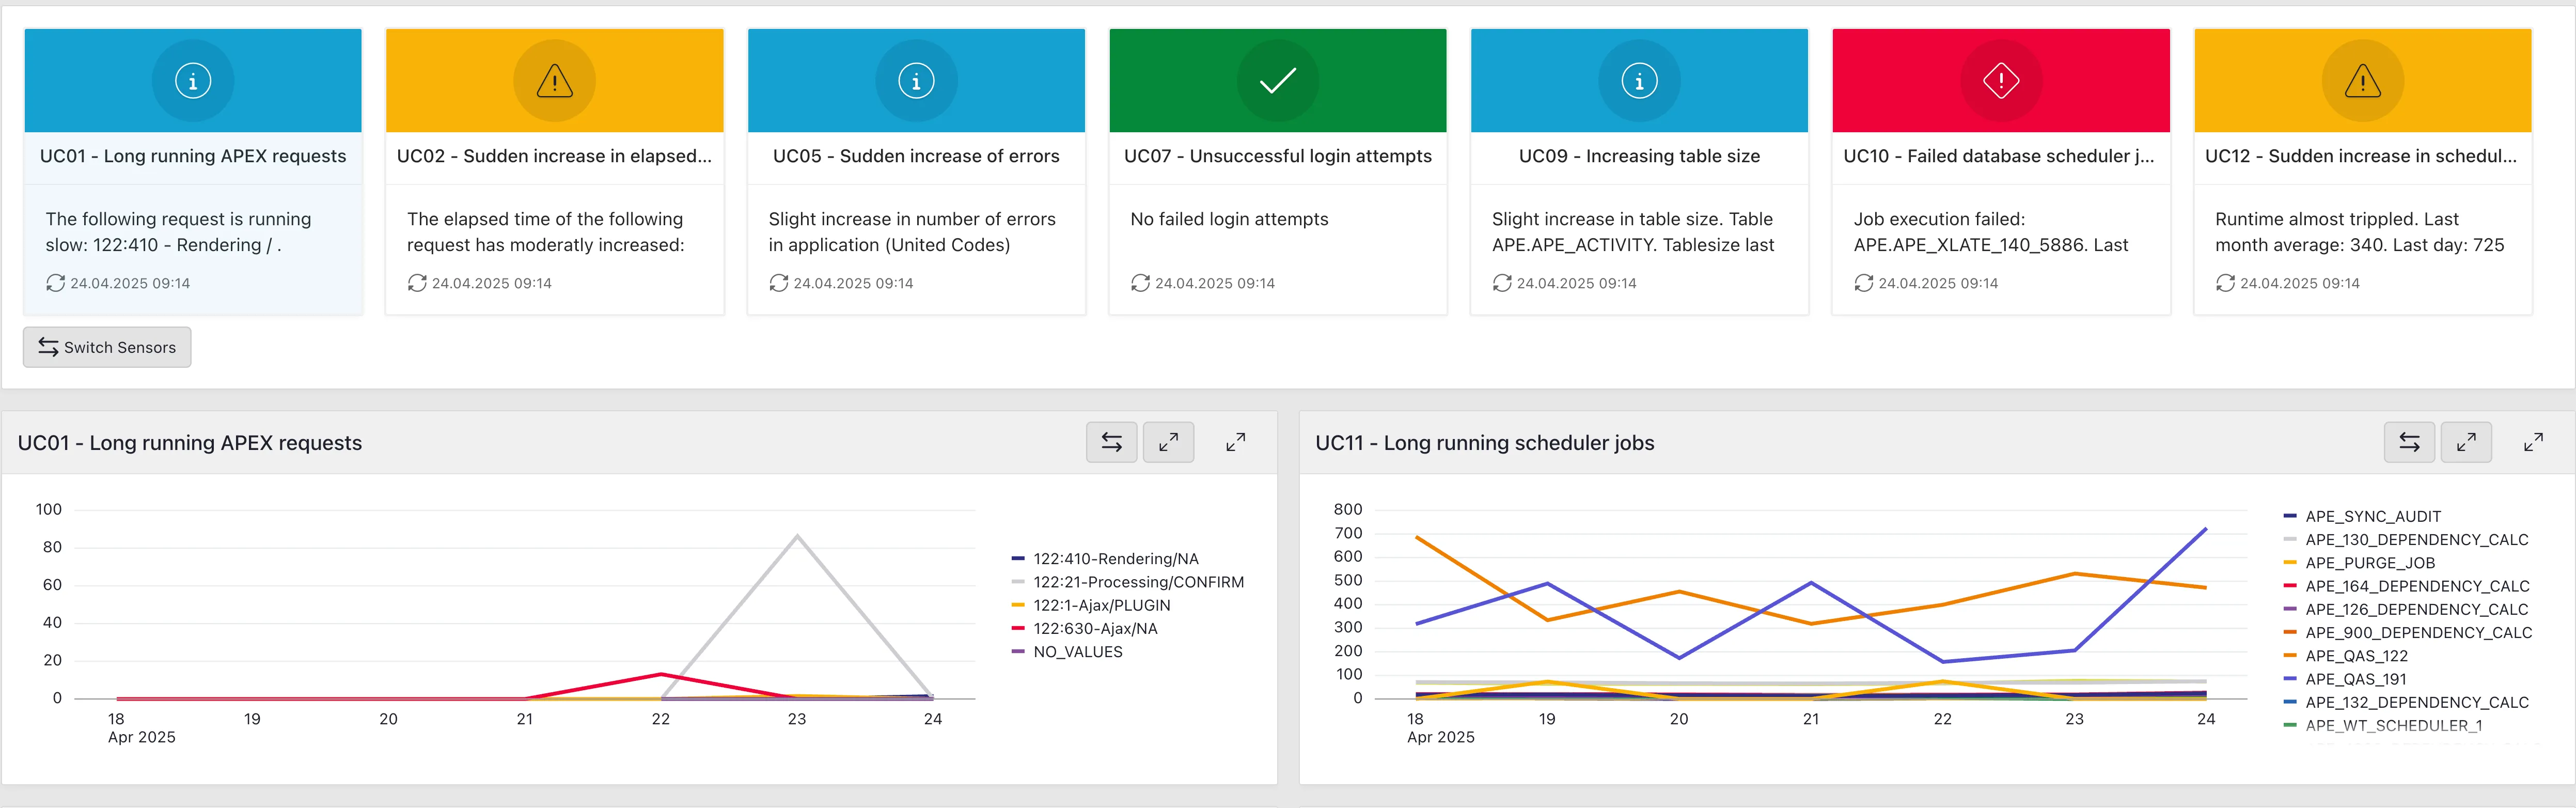
Customize your dashboard with glance cards, charts showing the history and and a daily view.
Related APE Features
Section titled “Related APE Features”- Quality Assurance: Monitor compliance with quality standards over time
- Documentation Generation: Include monitoring configuration in application documentation
- DB and ORDS Dashboard: Set up sensors for critical database metrics
- Activity Reporting: Correlate user activity with system performance